Know which roads are cut before the convoy leaves.
Route Disruption Mapping compares the latest usable pass over your road and bridge network with the one before it, and marks each segment that has been cut, washed out or blocked. Every flag comes with the before and after image behind it.
Ground reports
Route Disruption Mapping
- Cut
- No change
- Not visible
- GSD
- ≤0.5 m (VHR)
- Cadence
- Event driven
- Platform
- VHR satellite / aerial
- Spectral
- RGB
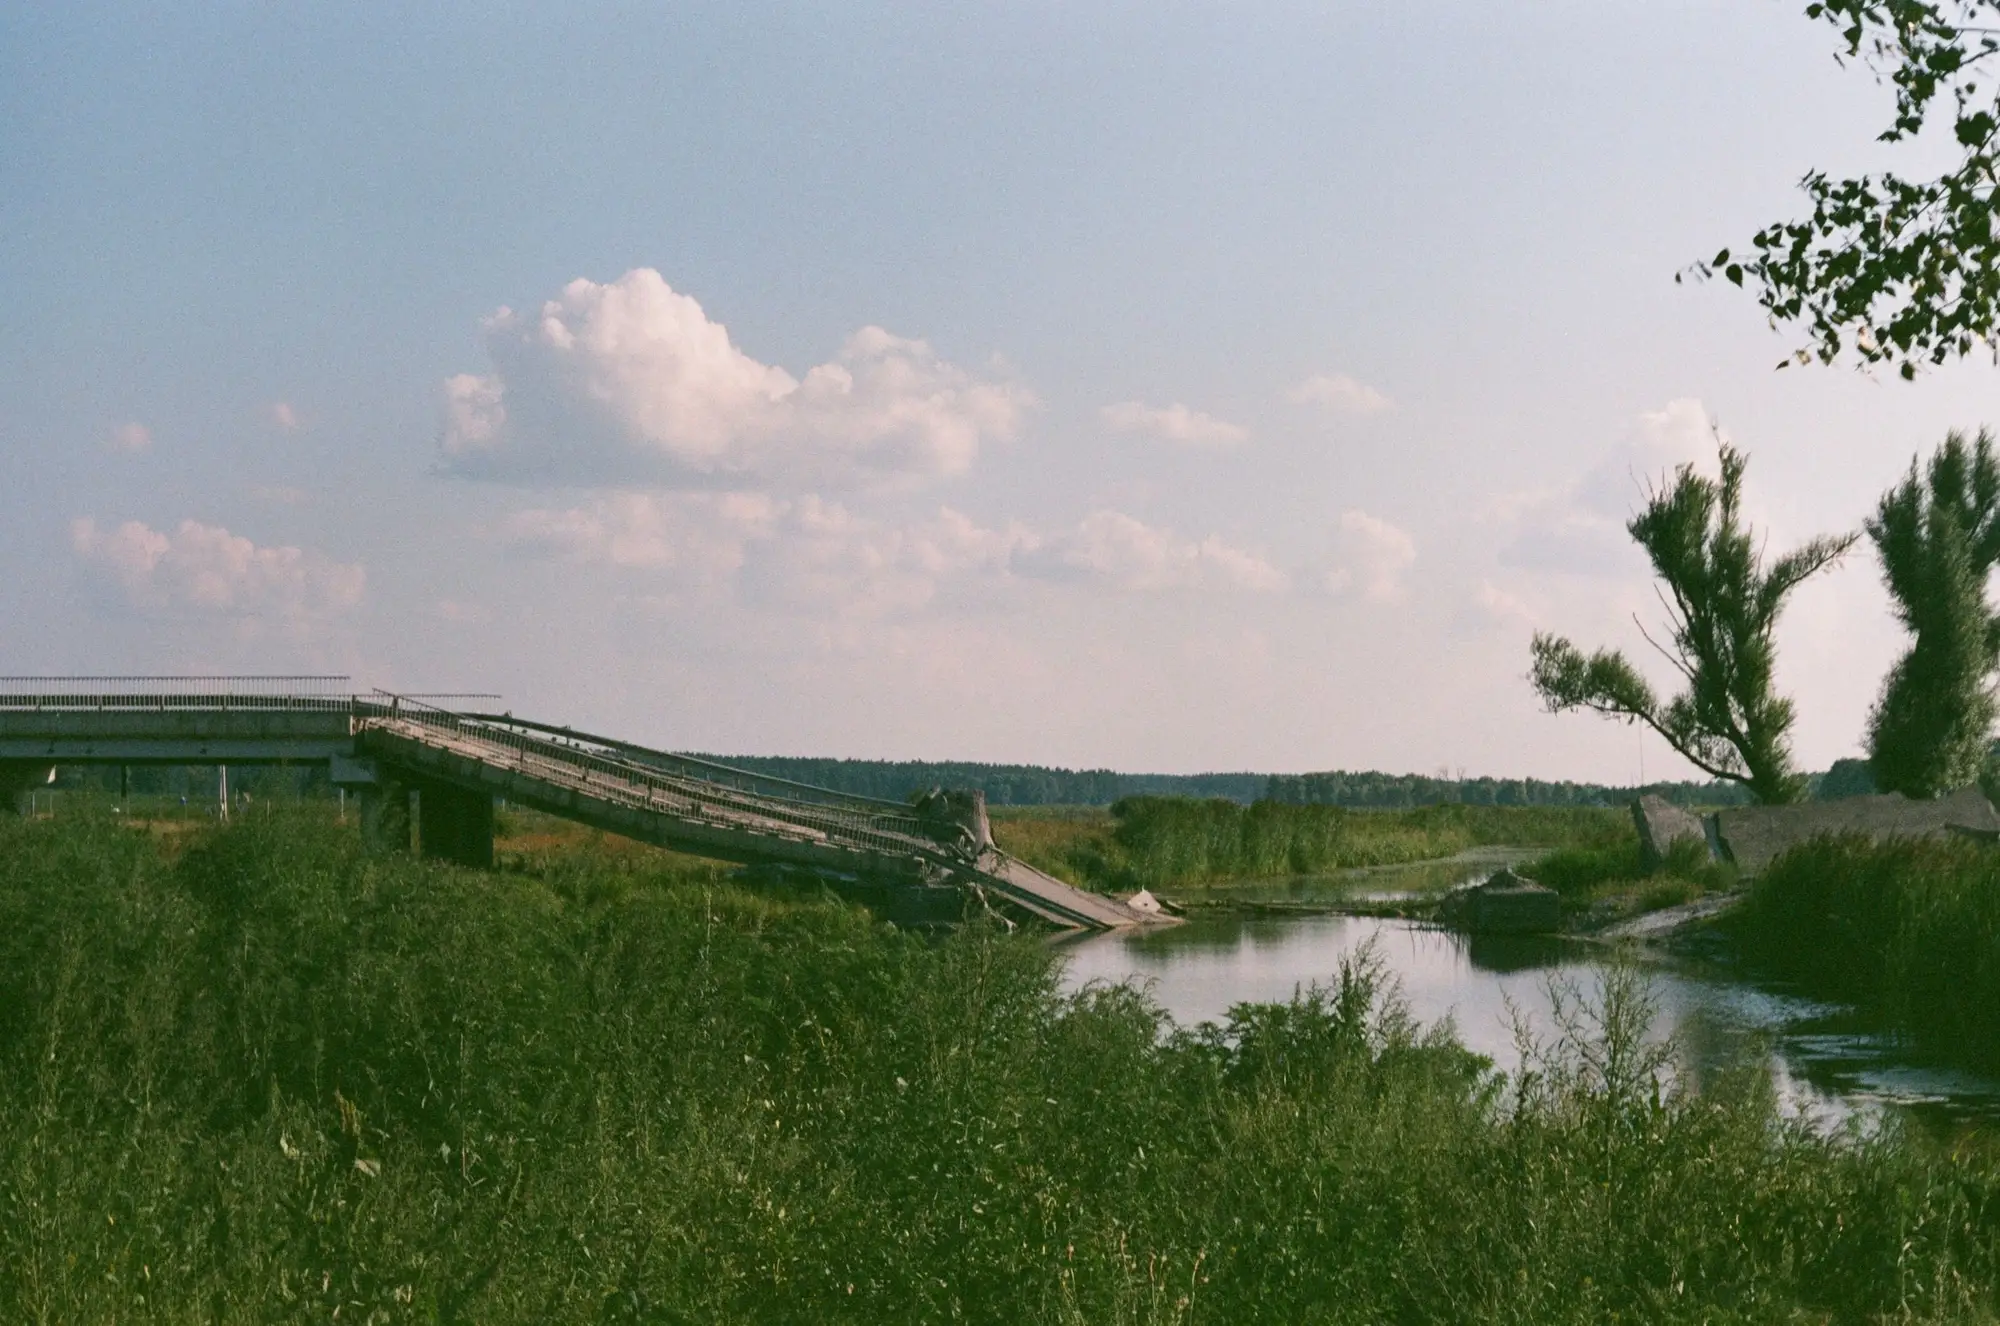
The job today
The routing meeting runs on whatever has come in
A partner reports a bridge out on one road. A driver calls from a washout and can't say how long it runs. Someone forwards a photo with no location on it.
The information management officer updates the access constraints map by hand, and the roads nobody has written about stay open on it because nobody has looked. Tomorrow's convoy is planned from that map. The first you learn a section is gone is when the lead truck stops in front of the gap.
Ground reports and the change map, step by step
01Building the road picture
Ground reports
Partner messages, driver calls and assessment missions arrive in no order, and the map is updated by hand as they do.
Route Disruption Mapping
You send the roads and bridges you need tracked. The layer marks every cut segment the imagery shows across that whole network, in one delivery.
Still yours
The wider access picture, including checkpoints, security and permits, which imagery does not show.
02Roads nobody has reported
Ground reports
No report reads as an open road. Silence and a clear road look the same on the map.
Route Disruption Mapping
Every segment in the network gets a result. Where the pass could not see a segment, it is listed as not visible, never as clear.
03Weighing a single report
Ground reports
One message says a bridge is down. You decide how far to trust it with no image to check.
Route Disruption Mapping
Each flag carries the before and after image pair behind it, so the person in the meeting can look at the span and judge for themselves.
Still yours
Deciding whether a flag changes the plan.
04Finding the way round
Ground reports
Planners mark the cut on a map, then ring drivers and partners to ask which alternate route is holding.
Route Disruption Mapping
The cuts arrive as a GeoJSON layer you drop into your own GIS or routing tool, on top of the roads you already use. You see the alternate routes against the flags.
Still yours
Choosing the alternate route and the order of the convoy.
05Clearing a crossing for the trucks
Ground reports
Someone drives out, looks at the bridge and radios back.
Route Disruption Mapping
The imagery shows whether a span is visibly down or missing. It says nothing about a bridge that is standing.
Still yours
All of the safety call. Load rating, a ground check and the decision to cross stay with your engineers and your drivers.
What you get
What arrives with each pass
GeoJSON
Disruption layer
The cut segments, washouts, downed bridges and debris blockages, flagged as line and point features on your network. Opens in ArcGIS, QGIS or the map your planners already use. One delivery for each usable pass.
This is the building-the-road-picture and finding-the-way-round rows.
Image pairs
Before/after image pairs
The two passes behind every flag, cropped to the segment, with the capture date on each. They are what you put on the screen in the routing meeting.
List
Not-visible list
Segments the pass could not see because of cloud, shadow or darkness, each with a reason. They stay on the ground check list.
How it works
Before an event
You send the roads and bridges you want tracked, as a line layer with segment IDs or a boundary we agree the segments inside with you. We hold the last clear pass over them as the baseline.
When the event happens
Tell us the area and the date. We task a very-high-resolution satellite or aerial pass over the network.
When a usable pass comes in
We compare it with the baseline, segment by segment, and mark what has changed. A pass with cloud over part of the network is compared where it can be, and the rest waits for the next clear one.
Delivery
The disruption layer, the image pairs and the not-visible list go to you together. After the first delivery we refresh the layer for each new usable pass for as long as you need it.
Limits
Where ground reports still do better
Imagery shows what is visible from above. A driver on the road knows about a soft shoulder, a checkpoint, a ford that is too deep for a truck and a bridge that looks fine but will not take the load. None of that is in a picture.
Event driven, not continuous
The layer follows the passes. It arrives when a usable pass comes in, not continuously, and the days between passes are covered by your ground reports, as they are now.
Cloud and darkness
Optical imagery needs daylight and a clear view. After a storm the sky may stay covered for a while, and the layer waits for the next clear pass. A gap in the layer is a gap in coverage. It does not mean the roads are fine.
Resolution floor
At 0.5 m a pixel is half a metre across. A downed span or a washout across a road shows clearly. A small blockage, a narrow track or a road under tree canopy may not, and those segments are listed as not visible.
Status now, not a forecast
The layer says what is cut on the date of the pass. It does not say when a road will reopen, and it gives no damage severity or cost.
Who it's for
Switch if
- You coordinate the logistics for a relief operation and plan convoy movements over a road and bridge network.
- Your road picture comes from partner reports and a map updated by hand, and you would rather see the whole network in one layer.
- Your information management officer wants something that opens in the cluster's GIS as a file.
Stay with ground reports if
- You need to know a bridge will carry a loaded truck. That is an engineering call.
- You need a road's status this hour rather than at the last usable pass.
- You need a reopening date or a repair estimate.
FAQ
Questions before a project
Does this clear a bridge for the trucks?
No. It flags visible disruption, such as a span that is down or missing. A standing bridge with no flag has not been cleared for anything. Load rating and safety are engineering calls, and a ground check comes before the trucks go.
How soon after an event do we get the layer?
When a usable pass is available. Cloud or darkness can delay that, and we do not put a delivery time on it in advance.
Does it cover unpaved and rural roads?
Only where the road can be seen at this resolution. Narrow tracks and roads under trees may come back as not visible.
How do we check it against what our partners tell us?
Compare the flags with your own reports for the same network, using the image pairs. Where the two disagree, the pair shows what the imagery saw on which date, so you can decide who is right.
Will it load into our GIS?
It comes as GeoJSON, which ArcGIS and QGIS read, so it can go on top of your own network layer. We do not write into your systems directly.
Do you predict when a road will reopen?
No. It reports what is cut on the date of the pass.
Who owns the layer and the imagery?
Ownership and licence terms for the layer and the underlying imagery are written into the project agreement before anything is ordered. Ask for them early if your legal team needs to read them.
How is a project priced?
It depends on the size of the network and the imagery source, and we scope it for your area. We do not publish a price.
Map today's disruption before you route tomorrow's convoy.
Tell us the network and the area you cover. We will say what an event pass over it would show and what it would leave out.